
Have you ever wondered why your ad revenue drops so suddenly at the beginning of the year? Or how come you earn a bit more during the fall and winter months? Such value fluctuations must have worried you more than once and kept you thinking about what you did or should have done. It’s good to keep your finger on the pulse when it comes to money, but it’s even better to do so in the right context. Ad revenue is nothing more than a reflection of how receptive to ads are website visitors, hence how much advertisers spend on ads reaching your content recipients. That can be determined by many factors, including occasions during the same weeks each year. And that’s what we call seasonal tendencies.
What do seasons bring by
When analyzing your income, you use a variety of tools. But let’s take the one that records earnings for sites monetized in the programmatic model ⎼ Ad Revenue Index. Examining its graph, you can compare your revenue to ongoing wider tendencies. When you analyze RPMs’ changes recorded on the chart in the perspective of more than one year, you’ll spot some spikes and drops in value occurring at the same or similar periods. For example, look at January and February in the last two years. Incomes are relatively low compared to what you could see just a moment earlier, in December. So you wonder, what happened in those few days that your ads suddenly make less money? That’s the thing ⎼ nothing! Those value decreases are the effect of seasonality, which you can’t impact, but you can gain from.
What you see as random fluctuations is very often an anticipated change resulting from consumer behavior. There are periods of the year bringing annual rises in values because it’s time for people to spend more money, and therefore advertising budgets grow. Hence, your ads earn more. Such moments can be foreseen because they repetitively induce spending opportunities for all of us.
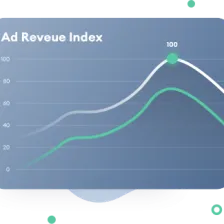
Ad Revenue Index
Your earnings from a broader perspective
Index of websites’ programmatic advertising revenue, detailing daily trends and available for free 24/7.
Learn moreSo is it up to the weather?
Let’s look closer at what causes those tendencies. As mentioned above, there are periods when people are spending more in general. What does it mean? During the year, some holidays and celebrations impact global markets. Christmas is a great example. At that time, our digital and traditional surroundings are flooded with occasions, sales, and what’s most important for us ⎼ ads. People tend to spend like crazy around this time, and ad revenue is simply reflecting on that.
So let’s investigate the Ad Revenue Index again to spot the most significant seasonal tendencies. The most noticeable fall in value throughout the year happen in the first quarter (Q1), which is much more visible because of high incomes in December. After weeks of high spendings, the beginning of the year is time for advertisers to take a deep breath, verify and establish new budgets. Customers are also drained after the holiday season, and their spendings decrease naturally. Both of these factors influence each other. There are fewer ads, and people are not so responsive to them since they purchase less. Therefore, you experience lower income.
The peak money-making time for publishers falls in Q4. From October to December, RPM values fly sky high because of all the shopping-related events. In this quarter, there are multiple cultural holidays like Christmas or Diwali Festival; and commercial ones like Black Friday or Amazon Prime Day. Those make customers more receptive to ads since they physically buy more. The most soaring revenue is annually noted on Black Friday, proving just how global this shopping celebration went. Since Black Friday typically sets the highest RPM for the year, you notice a minor fallout a few days after, which you shouldn’t worry about! It’s just a natural step after reaching the highest achievable value. But what’s important is that the spending trend keeps on going almost until the end of the year, so compared to earlier months ⎼ you still acquire impressive income.

Described above are the most compelling tendencies, but it’s not like nothing else happens in between. On the way, there are other variations worth looking into. Even though Q1 is known for relatively flat revenues, there are lifts in RPM rates in time for occasions like Easter. Overall, the calm middle of the year brings both decreases and increases in incomes. First, the summer slump, caused by the vacation season when the Ad Revenue Index records lower values reflecting on reduced activity of both advertisers and customers. But moving towards fall, Q3 brings Back to School rush in August. And with that, your ad revenue brings back a smile onto your face.
Look out for other occasions
Except for those mentioned above, different industries might benefit from various occasions. Let’s dig into Q2 again. Late spring and early summer usually stand out for declined revenue for most, but the experience can be quite the opposite for a few. Outside Covid reality, those warmer weeks should focus the attention of publishers related to the travel and tourism industry. It’s time to plan vacations, so we go through dozens of websites looking for ideas, encountering tons of advertisements on the way. If the publisher realizes this period’s potential and personalized advertising, both sides of the equation gain!

It’s just a simple example, but it shows what you should look for. Any industry can find a niche when its audience is exceptionally responsive to ad emission. Just think of what you offer and when it best resonates with happenings offline. Does your website review home decorations and flowers? Stay tuned for Mother’s and Valentine’s Day! Do you get what I mean? Seek opportunities in moments that touch your target audience so that you can benefit from their time and attention spent online.
A wider perspective
So no matter how ridiculous it seems, when experiencing a sudden drop in earnings, check the calendar first! Befriend the idea of seasonality, so it helps you benefit from your audience’s experiences outside the digital world. Most importantly, though, seasonal tendencies allow you to analyze your ad revenue in a wider perspective with appropriate situational context. And trust me, you can profit from that more than you think. Go and check out a juxtaposition of your ad revenues for the last two or three years, look for again coming opportunities!
Read also

Ad servers are platforms publishers must be familiar with. They allow displaying and managing ads on the website or in the app. However, there is more to discover about ad servers, and you can easily explore more with just a single click!
Read more
How to install CAPTCHA WordPress plugins
Prevention is better than cure, also when it comes to ensuring the security of your website. If you're uncertain about how to install reCAPTCHA on your WordPress site or create reCAPTCHA key – you've arrived at the right destination!
Read more