
Keeping track of Core Web Vitals requires effort and commitment. Luckily, there’s an easy way to monitor these metrics actively. In this article, you will learn how to check the data regarding your website’s performance. Let’s dig in!
How to monitor Google Core Web Vitals
Generally, there are two ways that can be utilized to measure CWV: with the use of lab data or field data. In the first case, measurements are made using specialized tools in a regulated setting; in the second, data is collected during visits by real users. Although both methods are effective, they serve different purposes. Lab data is ideal for debugging or testing improvements. On the other hand, field data can prove helpful as a practical opponent that shows results on real devices in various geographical locations. There are several free Google tools that can provide you with either lab data, field data (or both) for Core Web Vitals monitoring:
- Lighthouse – with this tool, you are able to check Core Web Vitals metrics in a lab environment, your content accessibility, and even SEO performance. You can use Lighthouse via PageSpeed Insights; you can also run it with Chrome DevTools, Chrome Extensions, or the Node module;
- Chrome DevTools – an in-browser tool that’s suitable for developers interested in lab data;
- Web Vitals Chrome extension – an easy-to-use tool with which you can track Core Web Vitals on desktop devices as they happen (meaning it’s field data). However, it does not offer a comprehensive insight into the actual reasons behind achieved scores;
- Chrome User Experience Report (CrUX) – offers both lab and field data results from Chrome users. Unfortunately, this solution works only for bigger publishers, because if your website doesn’t have representative traffic, you wouldn’t be able to see Core Web Vitals scores;
- PageSpeed Insights – the undeniable advantage of this tool is the fact that it delivers both lab and field data reports on both desktop and mobile devices. Lab data is downloaded from Lighthouse, while field data is delivered from Chrome UX Report, and it covers a 28-day period;
- Search Console – this service from Google can help you monitor, maintain, and address any issues that may impact your website’s search performance. All gathered data are of the field type, collected from Chrome UX Report. This valuable tool is ideal for both developers and non-developers, as generating reports through Google Search Console is easy and fast.
Given the seamlessness of Google’s metrics monitoring using the last-mentioned method, this is the solution we decided to focus on. In the next paragraph, let’s take a closer look at the Core Web Vitals report, its structure, elements, and analysis in Google Search Console.

Google Core Web Vitals report
In order to access the Core Web Vitals report in Google Search Console, you have to:
1. Log into your Google Search Console account;
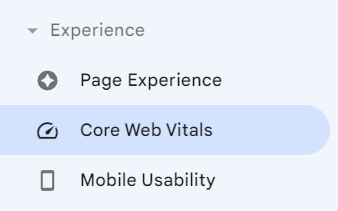
2. Go to “Core Web Vitals”, which can be found under the “Experience” section in a drop-down menu on the left side of the screen;
3. Here, you will see two charts, one above the other: one for “Mobile” data and the other for “Desktop”. Both of them showcase the number of URLs according to their CWV condition on a given day. The URLs are divided into three groups marked on the graphs with the following colors:
- green line shows the number of URLs that are considered good;
- the yellow indicates URLs that need improvement;
- and the red one – poor URLs.
The period of time presented in the charts concludes around two days prior to the present date and begins roughly three months earlier;
4. Click “OPEN REPORT” located in the top-right corner of each chart, to investigate further desktop or mobile results. After entering, you will see the same bar chart as on the page before, containing respectively mobile or desktop data. In order to see how many CWV issues were detected on a given day – select the chosen date on the timeline;

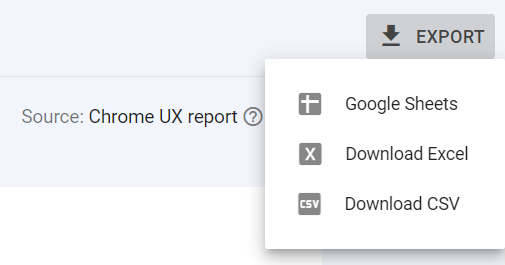
5. Here, you can also export all the displayed data. To download the report, click “EXPORT” (visible in the upper right corner) and choose the file type between Google Sheets, Excel, and CSV;
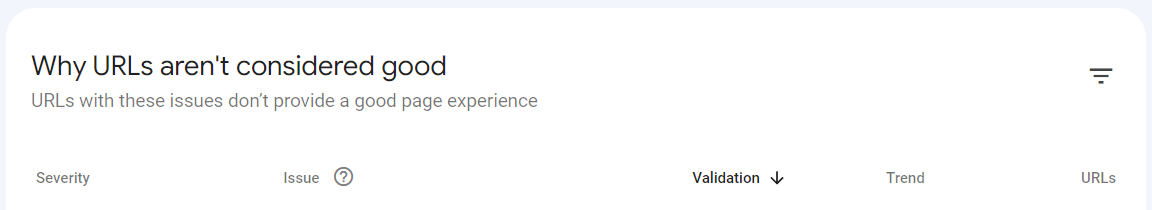
6. Scroll to the lower part of the page, where you’ll find the “Why URLs aren’t considered good” section. It’s a list of issues encountered within your URLs, labeled as “Poor” or “Need improvement”. Alongside each, you’ll find:
- the specific problem type detected (LCP, FID, CLS, or INP-related) and a concise description of the issue itself (like “LCP issue: longer than 2.5s (mobile)”),
- the “Validation” column, which states whether there were measures taken to fix the issue,
- the “Trend” column, providing graphical representations of this kind of error trends within your URLs,
- and “URLs” column, demonstrating the number of affected URLs by this particular issue;
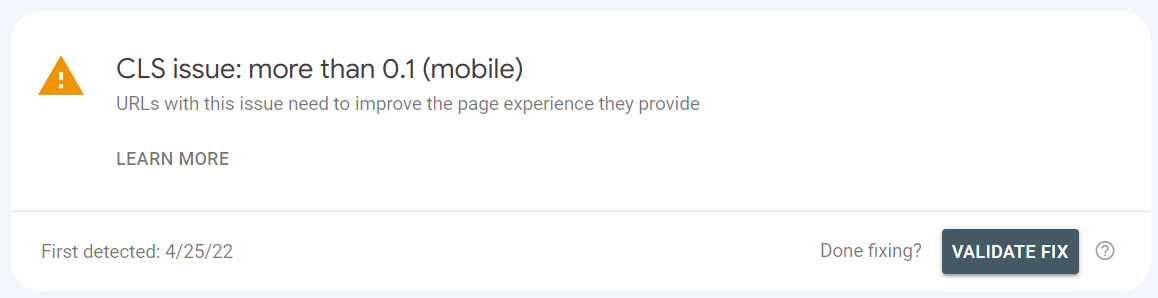
7. After selecting any of the issues from the “Why URLs aren’t considered good” list, you will be transported to another section, where you can get deeper insight into that particular issue. If you click “LEARN MORE”, you will be taken to a web.dev page dedicated to the respective CWV metric’s overview. Here, you can also see the date when the issue was first detected, as well as request an earlier validation of the measures you’ve taken to fix the reported issue by clicking “VALIDATE FIX”;
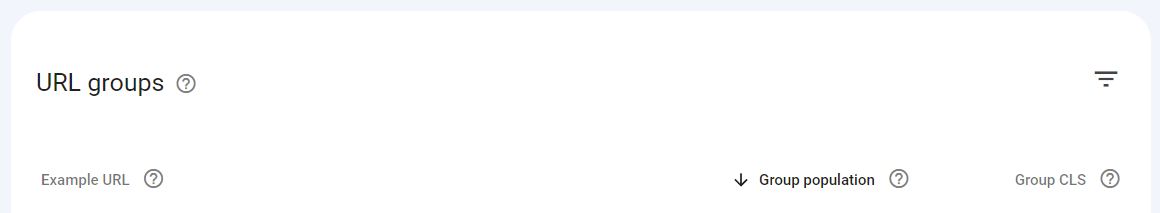
8. Below that, there’s a chart showing how many URLs were affected by this specific issue on a given day and the “URL groups” section. The section is composed of three columns:
- “Example URL”, where you can see examples of URLs where the issue was detected,
- “Group population”, meaning how many URLs are in this group,
- and a “Group LCP, CLS, FID or INP” (depending on which issue you are currently verifying). This number reveals the evaluated User Experience value for the respective URL group.
If you click on any of the positions in this section, a new window will pop up on the right, showing other examples of URLs in this group.
With the transition from First Input Delay (FID) to Interaction to Next Paint (INP) on the horizon, Google is taking steps to prepare publishers and developers for the shift. As part of this preparation, there’s a message displayed at the top of the “Core Web Vitals” page in your Google Search Console:

And then again in the “Desktop” and “Mobile” sections:

By clicking “INP issues table” or “table below”, you will be taken to a table (positioned beneath the URL graphs and “Why URLs aren’t considered good” section on both “Mobile” and “Desktop” pages). There you will see a list of all the INP-related issues detected on your website. If your URLs don’t demonstrate any error of this type, the following message will be displayed:

Halfway through the core of optimization
Alright, now that you know how to monitor the Core Web Vitals of your website, it’s time to take proactive steps and begin optimizing your pages! This action is certainly worth the effort, as statistics speak for themselves – some publishers, after implementing Core Web Vitals’ rules, improved their ad revenue by 18% and page views by 27%! Additionally, research implied that the average bounce rate of a site that achieves fine CWV scores is reduced by up to 24%! Don’t wait and find out how to improve your Core Web Vitals values to optimize your pages’ performance!
Read also

How to make money from a website or blog
Looking for some proven methods to earn on your digital content? Have a peek at this article, take notes and get ready to set sails!
Read more
Advertisement model vs. membership model – which to choose for your website
Do you want to spice up a little your monetization game, but you don’t know how to do it? In this article, we will present you with two great methods of content monetization. Your job is just to choose the right one!
Read more